This week’s Tidy Tuesday includes data on broadband usage in the United States. I started out with some exploratory analysis of this data set. Using linear regression, I modeled the relationship of broadband usage in a county to broadband availability (per the FCC), the poverty rate, median household income, the percentage of Black residents, and the county’s rural or urban character.
I found that each of these parameters had a statistically significant impact on broadband usage, but when constructing a multivariate model, I found that, of these factors, only broadband availability and median household income explained a significant amount of variance:
##
## Call:
## lm(formula = `BROADBAND USAGE` ~ `BROADBAND AVAILABILITY PER FCC` +
##     Median_Household_Income_2019, data = broadband)
##
## Residuals:
##      Min       1Q   Median       3Q      Max
## -0.46386 -0.07715 -0.00304  0.07454  0.73250
##
## Coefficients:
##                                    Estimate Std. Error t value Pr(>|t|)
## (Intercept)                      -3.538e-01  9.753e-03  -36.27   <2e-16 ***
## `BROADBAND AVAILABILITY PER FCC`  3.467e-01  9.739e-03   35.60   <2e-16 ***
## Median_Household_Income_2019      6.631e-06  1.607e-07   41.27   <2e-16 ***
## ---
## Signif. codes:  0 '***' 0.001 '**' 0.01 '*' 0.05 '.' 0.1 ' ' 1
##
## Residual standard error: 0.1216 on 3100 degrees of freedom
##   (40 observations deleted due to missingness)
## Multiple R-squared:  0.5916, Adjusted R-squared:  0.5913
## F-statistic:  2245 on 2 and 3100 DF,  p-value: < 2.2e-16
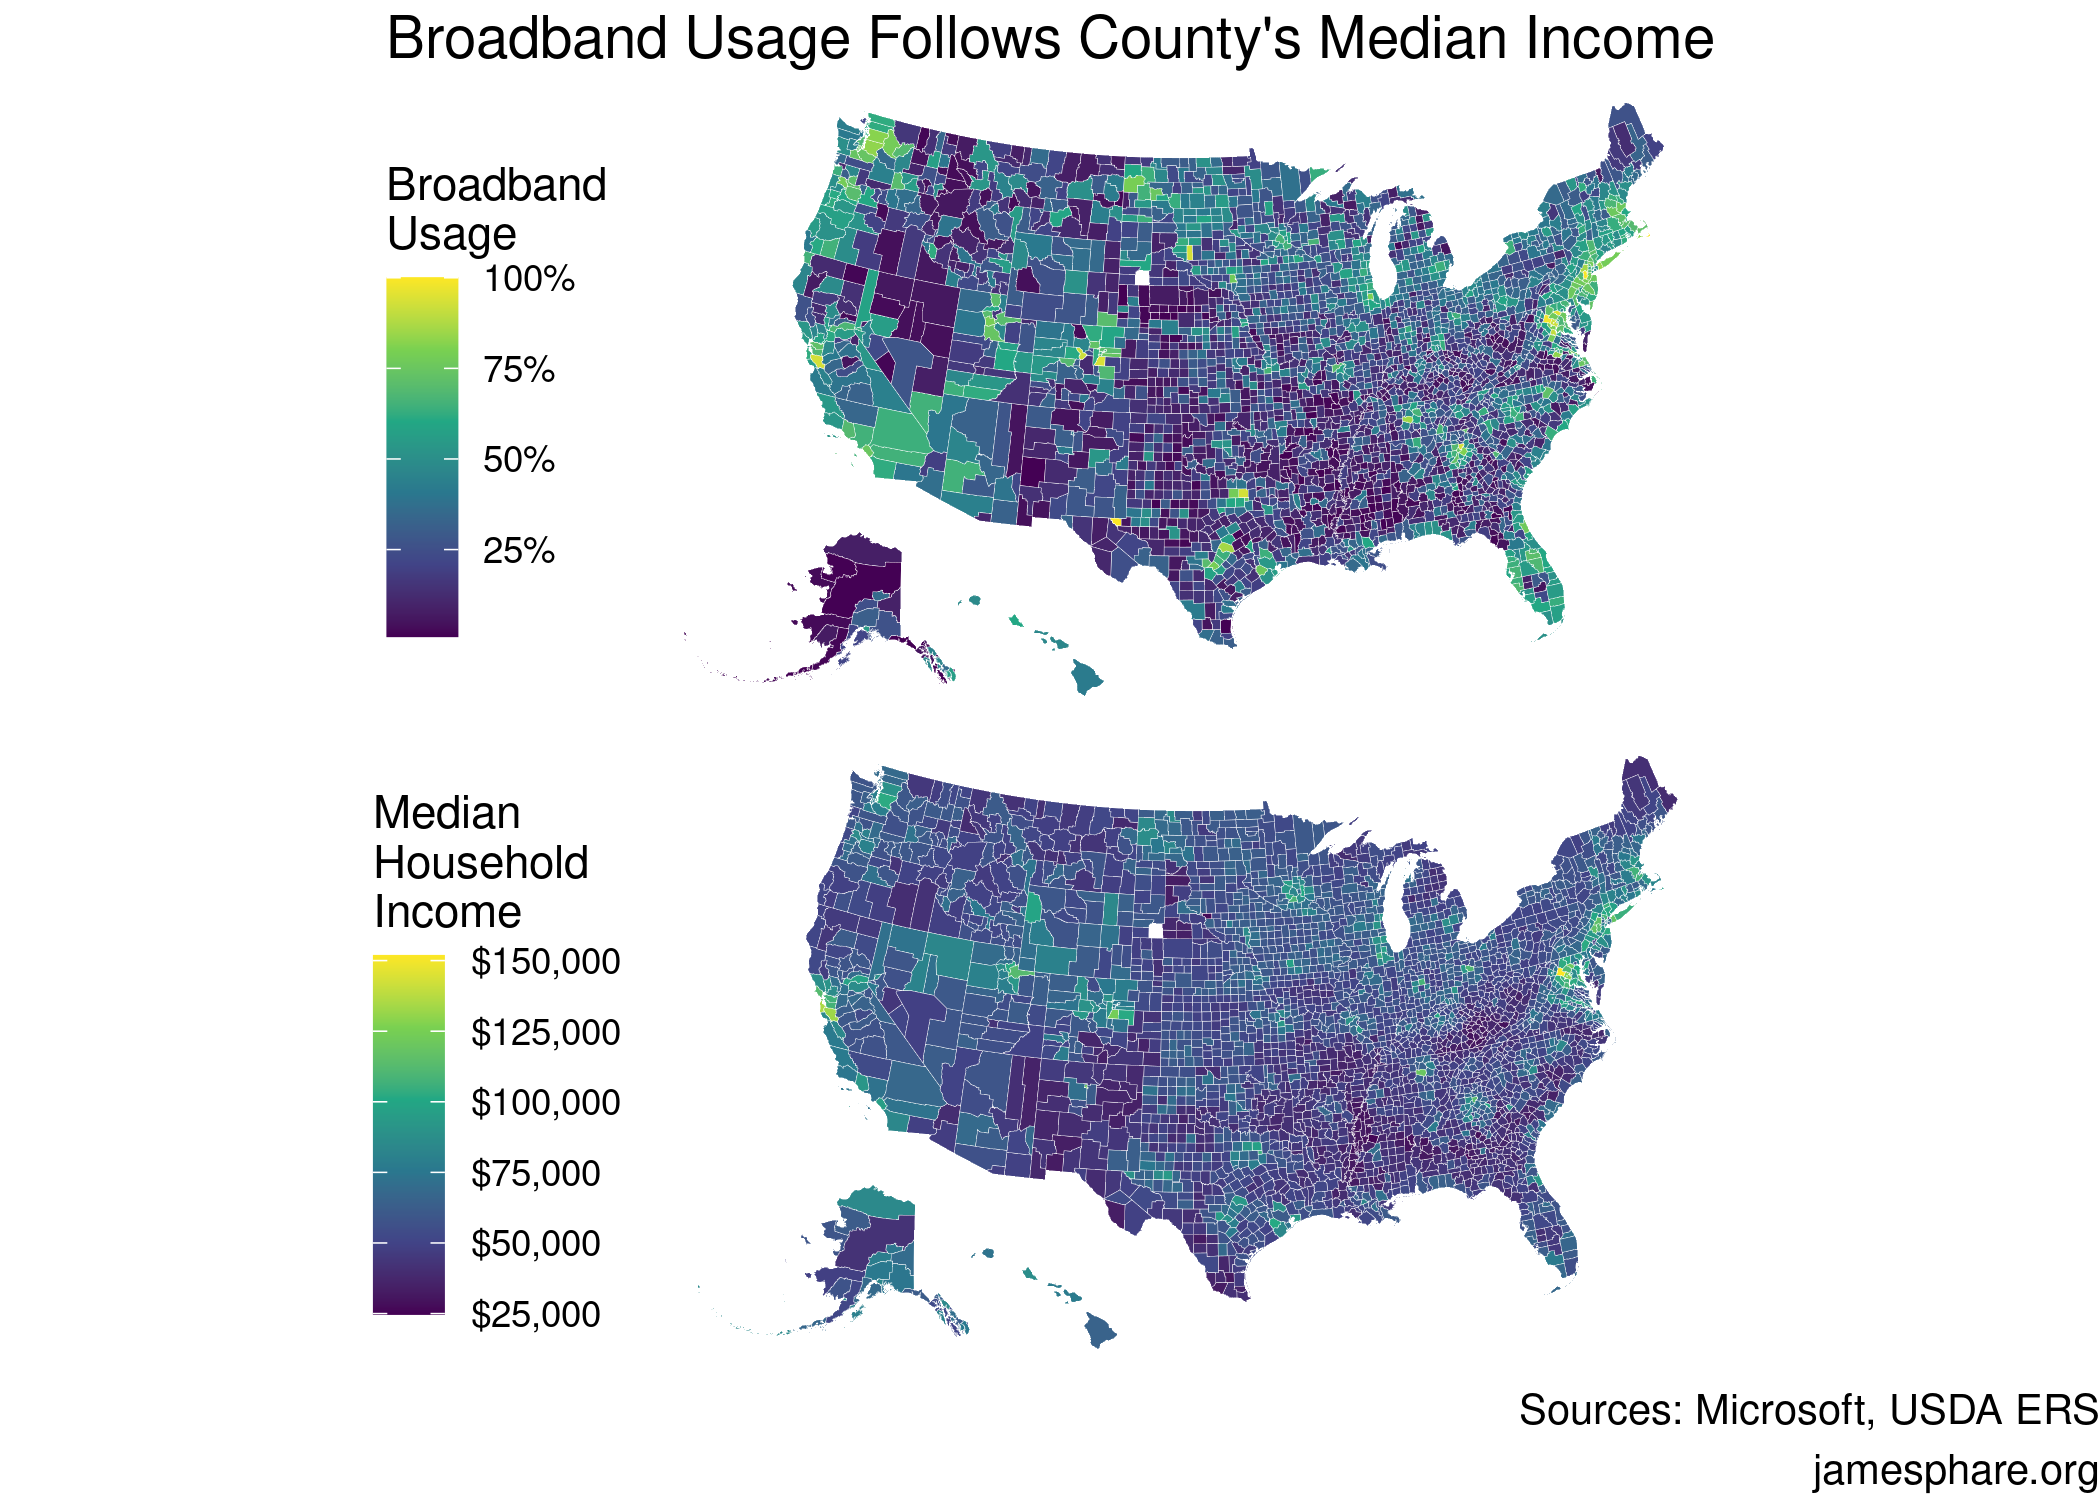
In order to visualize this finding, I decided to construct two choropleths, one showing broadband usage by county, the other median income. The similarities between these maps demonstrates the correlation between a county’s median household income and its broadband usage.
Source code available on GitHub.