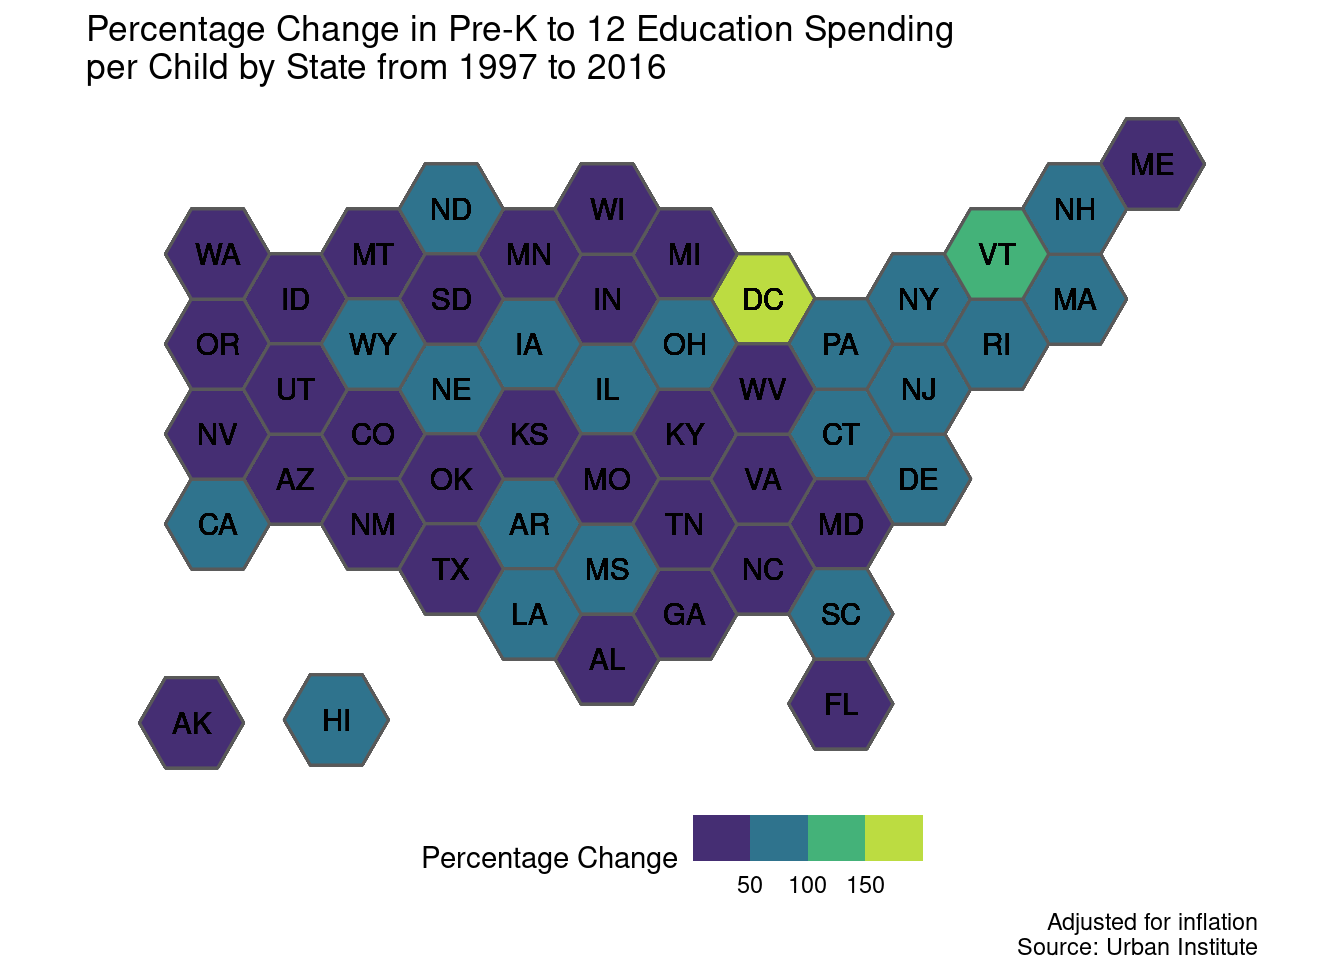
This week’s Tidy Tuesday takes a look the Urban Institute’s data on public spending on children from 1997 to 2016. I decided to narrow my focus to pre-k to 12 education spending and to look at the percentage change over this period in per-child spending, adjusted for inflation. This information would probably be best suited to a bar plot, but I wanted to learn how to make hex tile maps! Check out my source code on Github.